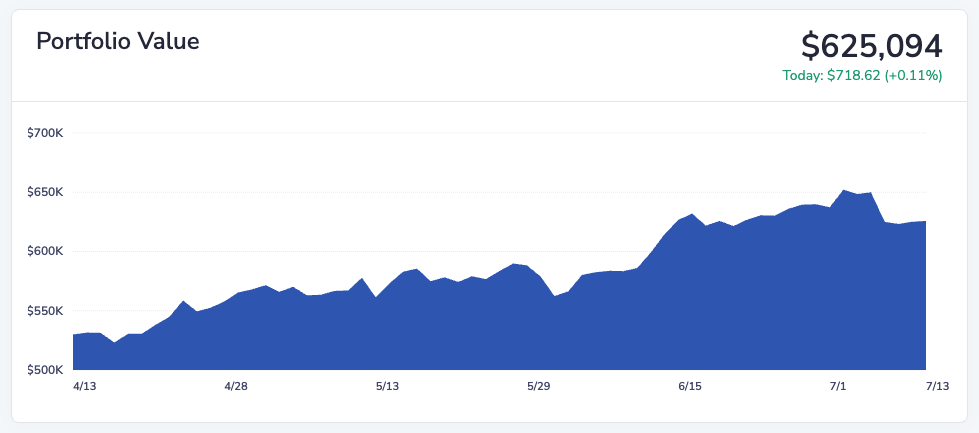
Monitor your portfolio value
See how your portfolio is performing over time with a clear view of total value and daily change.
See where you’re concentrated, how you’re diversified, what’s driving returns, and where risk sits—so you can make clearer decisions.
Get Started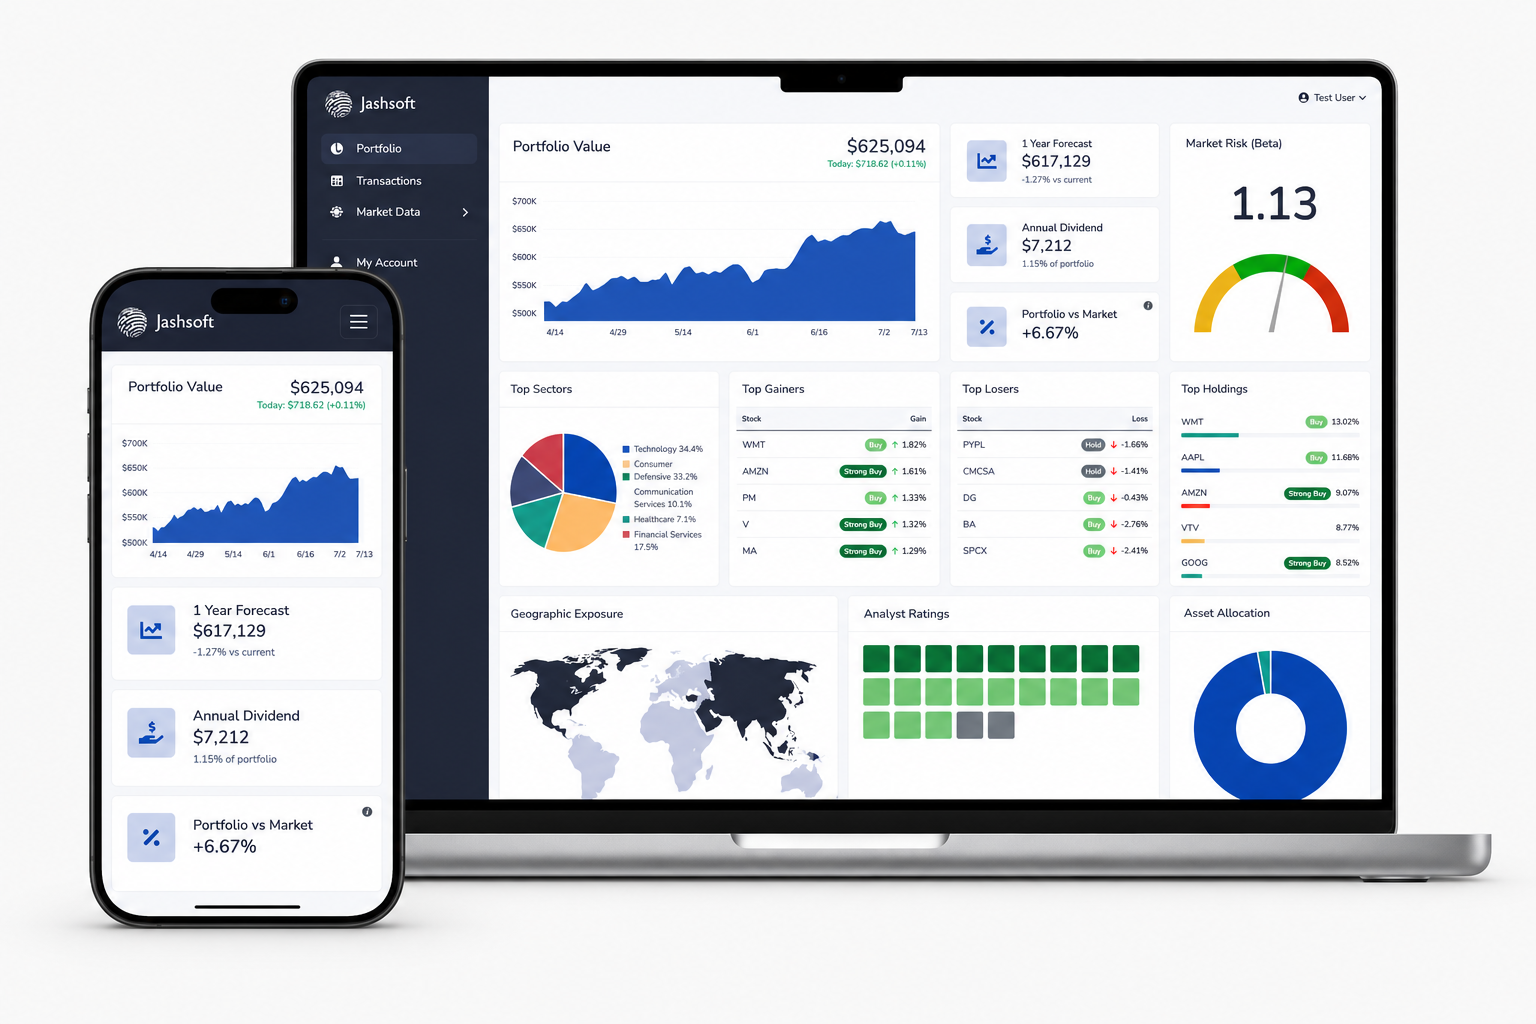
See how your portfolio is performing over time with a clear view of total value and daily change.
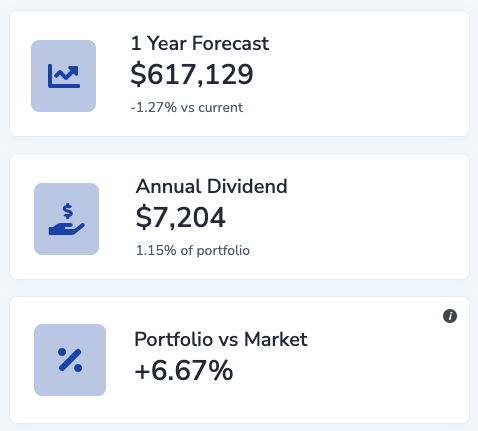
Project one-year value, annual dividends, and how your portfolio stacks up against the market.
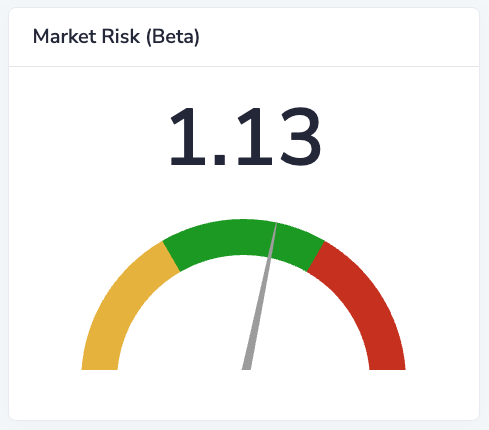
Gauge how volatile your portfolio is relative to the market with a clear, at-a-glance beta reading.
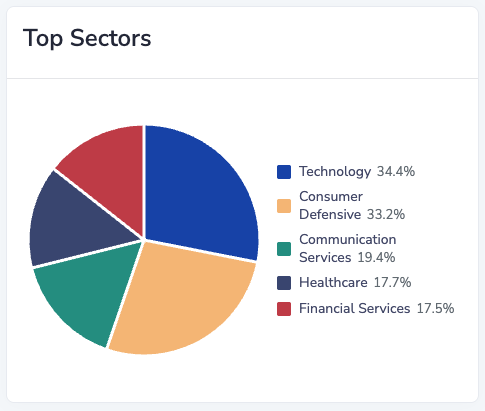
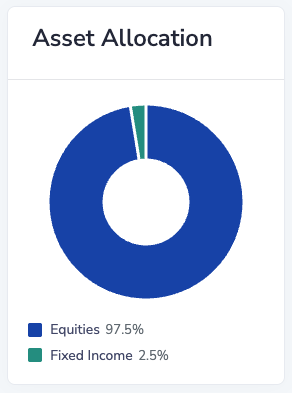
Break down exposure by sector and asset class so you know where your capital is concentrated.
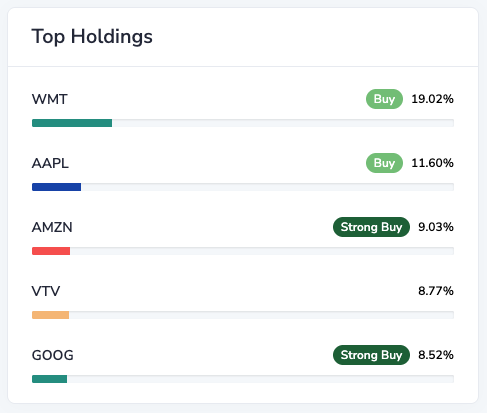
See concentration at a glance with allocation bars and analyst ratings for your largest positions.
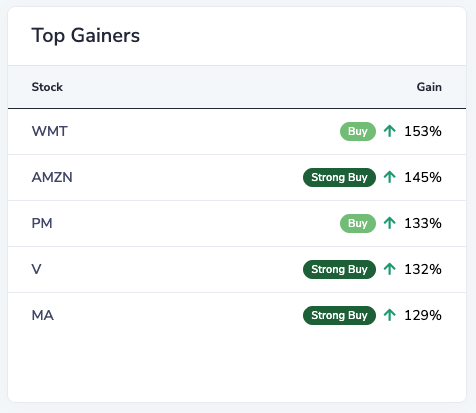
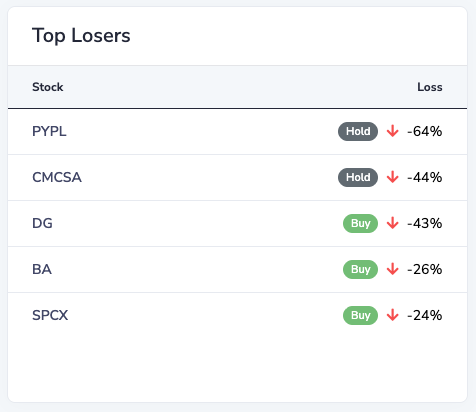
Learn from your best and worst performers with ratings alongside percentage moves.
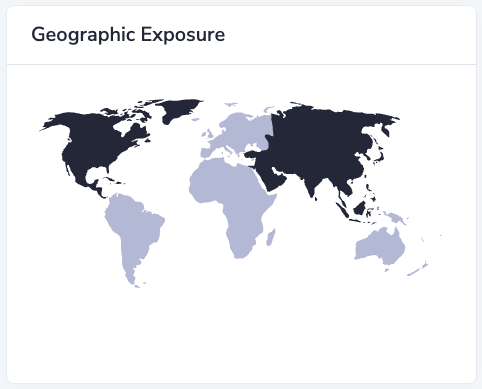
Visualize regional diversification across markets so you stay mindful of where your risks sit.
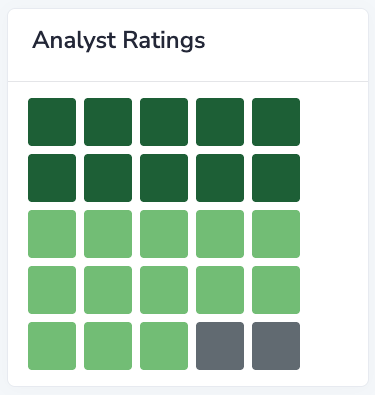
See consensus sentiment across your holdings with a compact ratings grid.
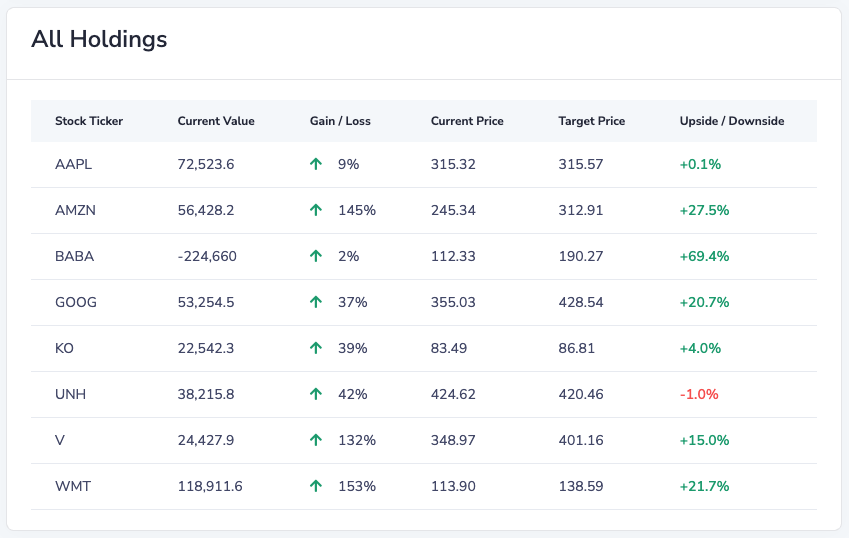
Compare current price to target price across your full holdings list—so you know where there’s room to run and where you’re overextended.
See Jashsoft in action—a walkthrough of the portfolio dashboard and key insights.