Monitor your portfolio value
See how your portfolio is performing by viewing a chart of your portfolio value for the last 6 months.
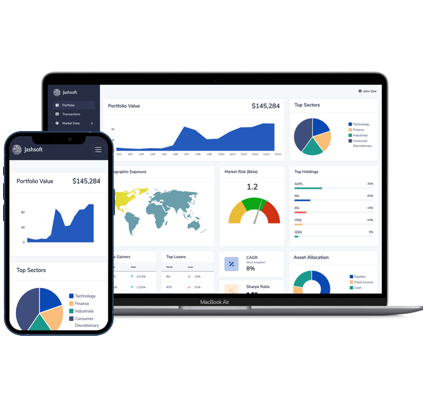

See how your portfolio is performing by viewing a chart of your portfolio value for the last 6 months.

View the exposure of all your holdings by sector. This allows you to be conscious of your allocation to each sector.

View the exposure of all your holdings by region. This allows you to be mindful of geographical diversification.

See how volatile your portfolio is by viewing the Beta for your aggregate portfolio.

View the top holdings for your portfolio, which can highlight if you are over-exposed to some securities over time.

Track your portfolio's best and worst performing securities, so you can learn from your decisions.

Indexes rise and fall in cycles. See your portfolio's computed CAGR to track if you are meeting your goals for annual returns.

Returns only make sense when you view them from a risk-adjusted perspective. Track your excess returns for unit of increased risk.

Monitor market data for regions & sectors to make informed decisions about sector rotation and regional allocation. Get comprehensive insights into market movements and trends across different asset classes.
Have questions about our portfolio management tools? We'd love to hear from you. Send us a message and we'll respond as soon as possible.